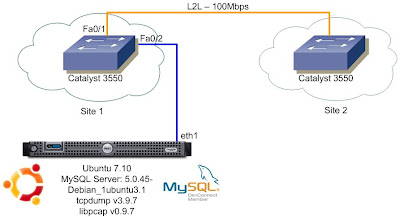
My first impulse was to install ntop on a new Ubuntu box, and starting collection of data. But we all know, ntop is not able to store statistics and after 20 or 24 hours over a 100 Mbps link we will have the ntop crashing and all useful information will be lost - except the rrdtool info.
Well, I gave up to try the ntop tool and decided to use a lower level approach, using tcpdump and mysql.
Simply writing the packets from tcpdump to mysql database is not an useful thing. With a 100Mbps link you will have 6.000.000 packets per hour. Your CPU usage will be huge after a few hours of collection inside mysql.
The solution to this issue is pretty simple. Consolidation of 5 minutes interval will decrease this to approximately 15.000 packets per hour, depending on your number of hosts. All you need to know is a little bit of SQL queries and how to use crontab.
I'm using a Core 2 duo, with 1 GB ram and 250 GBytes disk - I have installed Ubuntu 7.10.
The monitoring is possible using the session monitor from Catalyst 3550 - a simple port mirroring.

My L2L link is on FastEthernet0/1 and my Linux box on FastEthernet0/2.
Here's the configuration from Catalyst 3550:
monitor session 2 source interface Fa0/1
monitor session 2 destination interface Fa0/2
The first thing you'll have to do is install mysql. Simply type:
sudo aptitude install mysql-serverWhen asked define the password. In this example I'm using "xxxxxx" as password.
After mysql installation you have to create the database and tables to store data - the queries:
# Mysql Database and Table creationThis is the basic script that collects the tcpdump to a file. I'm not recording all the fields, just the source, destination and size. Actually only source is necessary. This file increases fast in size. Take care of this one at least once a day (I.e.: stop tcp dump and delete it using cron on some low traffic period).
CREATE DATABASE collection;
USE collection;
CREATE TABLE packets (
id INT NOT NULL AUTO_INCREMENT PRIMARY KEY,
cur_timestamp TIMESTAMP(8),
source VARCHAR(15),
destination VARCHAR(15),
pack_size DECIMAL(15,0)unsigned not null
);
CREATE TABLE networks (
id INT NOT NULL AUTO_INCREMENT PRIMARY KEY,
ip VARCHAR(15),
mask VARCHAR(15),
name VARCHAR(30)
);
CREATE TABLE media (
id INT NOT NULL AUTO_INCREMENT PRIMARY KEY,
start_time TIMESTAMP(8),
end_time TIMESTAMP(8),
source VARCHAR(15),
num_packets INT,
total_transfer INT,
average INT
);
mysql-collect.sh
The next step is to write another script that will run every hour and keep our database smaller, consolidating information about every host, on 5 minutes interval:
consolida.sh
You can put these files on /etc/init.d directory and navigate thru there.
To make mysql-collect.sh start on every machine startup just type:
sudo chmod +x /etc/init.d/mysql-collect.sh
sudo update-rc.d mysql-collect.sh start 99 2 .
Then put consolida.sh on your crontab file, typing:
sudo chmod +x /etc/init.d/consolida.shthen on the editor you insert the line:
crontab -e
00 * * * * /etc/init.d/consolida.sh
When this script finishes to run you get on /var/log/messages the information:
[Consolida Fri Jan 25 15:00:02 BRST 2008] Starting Consolida 25/01/2008-14h [Consolida Fri Jan 25 15:10:05 BRST 2008] End Consolida
This means that the mysql takes 10 minutes to consolidate 60 minutes of traffic - it's a lot of information.
Now you are able to verify the 20 top talkers on and determined period of time with a simple mysql query:
SELECT * FROM media WHERE start_time='2008-01-25/14:00:00' LIMIT 20;--------------
select * from media where start_time='2008-01-25/14:20:00' LIMIT 20
--------------
+-------+---------------------+---------------------+--------------+-------------+----------------+---------+
| id | start_time | end_time | source | num_packets | total_transfer | average |
+-------+---------------------+---------------------+--------------+-------------+----------------+---------+
| 77287 | 2008-01-25 14:20:00 | 2008-01-25 14:24:59 | 10.195.1.16 | 19494 | 26310686 | 701618 |
| 77288 | 2008-01-25 14:20:00 | 2008-01-25 14:24:59 | 10.80.3.1 | 28903 | 16832161 | 448858 |
| 77289 | 2008-01-25 14:20:00 | 2008-01-25 14:24:59 | 10.195.1.47 | 16932 | 16433531 | 438227 |
| 77290 | 2008-01-25 14:20:00 | 2008-01-25 14:24:59 | 10.195.1.56 | 95814 | 15102357 | 402730 |
| 77291 | 2008-01-25 14:20:00 | 2008-01-25 14:24:59 | 172.23.5.52 | 9947 | 12391601 | 330443 |
| 77292 | 2008-01-25 14:20:00 | 2008-01-25 14:24:59 | 10.195.1.15 | 19739 | 11280969 | 300826 |
| 77293 | 2008-01-25 14:20:00 | 2008-01-25 14:24:59 | 10.80.3.45 | 23596 | 10848085 | 289282 |
| 77294 | 2008-01-25 14:20:00 | 2008-01-25 14:24:59 | 10.80.3.225 | 11965 | 10055957 | 268159 |
| 77295 | 2008-01-25 14:20:00 | 2008-01-25 14:24:59 | 10.195.1.201 | 5900 | 8759995 | 233600 |
| 77296 | 2008-01-25 14:20:00 | 2008-01-25 14:24:59 | 10.76.19.20 | 5193 | 7674389 | 204650 |
| 77297 | 2008-01-25 14:20:00 | 2008-01-25 14:24:59 | 148.91.2.241 | 17668 | 6162209 | 164326 |
| 77298 | 2008-01-25 14:20:00 | 2008-01-25 14:24:59 | 10.195.1.28 | 17941 | 6050186 | 161338 |
| 77299 | 2008-01-25 14:20:00 | 2008-01-25 14:24:59 | 172.23.4.228 | 25362 | 3857761 | 102874 |
| 77300 | 2008-01-25 14:20:00 | 2008-01-25 14:24:59 | 10.194.1.32 | 4960 | 3733610 | 99563 |
| 77301 | 2008-01-25 14:20:00 | 2008-01-25 14:24:59 | 10.76.19.21 | 2389 | 3376997 | 90053 |
| 77302 | 2008-01-25 14:20:00 | 2008-01-25 14:24:59 | 10.20.1.3 | 2280 | 3175395 | 84677 |
| 77303 | 2008-01-25 14:20:00 | 2008-01-25 14:24:59 | 10.80.3.69 | 5331 | 2828996 | 75440 |
| 77304 | 2008-01-25 14:20:00 | 2008-01-25 14:24:59 | 10.195.1.18 | 43485 | 2810093 | 74936 |
| 77305 | 2008-01-25 14:20:00 | 2008-01-25 14:24:59 | 10.195.1.84 | 18565 | 2729074 | 72775 |
| 77306 | 2008-01-25 14:20:00 | 2008-01-25 14:24:59 | 10.194.1.13 | 3440 | 2621495 | 69907 |
+-------+---------------------+---------------------+--------------+-------------+----------------+---------+
20 rows in set (0.10 sec)
This is an working example of how to collect data using tcpdump. If you need more information fields regarding source port or destination it can be easily collected from tcpdump with some tweak on 'awk' and tcpdump parameters.
Another option is use tshark instead of tcpdump. The problem with tshark is the huge amount of CPU power needed over a 100 Mbps link. If your objective is to monitor a low speed link, the tshark is easier to use than tcpdump.
Good luck!


